🕸️ Net(work)
Net

- class fibermat.net.Net(*args, **kwargs)
A class inherited from pandas.DataFrame to build a fiber network.
It describes nodes and connections between fibers within a
Matobject:nodes are defined as the nearest points between pairs of fibers.
connections link pairs of nodes to define relative positions between fibers.
Parameters
- matpandas.DataFrame, optional
Set of fibers represented by a
Matobject.
Other Parameters
- periodicbool, optional
If True, fibers are duplicated for periodicity. Default is True.
- pairsnumpy.ndarray, optional
Pairs of fiber indices used to find nearest points. Size: (m x 2).
- kwargs :
Additional keyword arguments ignored by the function.
Note
The constructor calls
init()method if the object is instantiated with parameters. Otherwise, initialization is performed with the pandas.DataFrame constructor.- Use:
>>> # Generate a set of fibers
>>> mat = Mat(100)
>>> # Build the fiber network
>>> net = Net(mat)
>>> net
      A   B         sA         sB         xA         yA         zA         xB         yB         zB
0     0   0  12.500000 -12.500000   6.057752  20.856058 -24.338157  -1.176401  -3.074404 -24.338157
1     0   2   3.938063  -1.799582   3.580217  12.660413 -24.338157   3.580217  12.660413 -23.967450
2     0   3   6.509881   8.253676   4.324414  15.122205 -24.338157   4.324414  15.122205 -23.766064
3     0   5   0.269800  -7.165082   2.518746   9.149084 -24.338157   2.518746   9.149084 -21.802237
4     0   6 -10.466114   6.264470  -0.587864  -1.127531 -24.338157  -0.587864  -1.127531 -21.637518
..   ..  ..        ...        ...        ...        ...        ...        ...        ...        ...
862  95  95  12.500000 -12.500000 -14.234141  11.919304  23.096819 -17.446723 -12.873423  23.096819
863  96  96  12.500000 -12.500000  15.557356 -19.115497  23.645974  -6.906063  -8.143040  23.645974
864  97  97  12.500000 -12.500000 -12.739951 -17.721142  23.874757 -35.249295  -6.843209  23.874757
865  98  98  12.500000 -12.500000  17.087939 -34.582099  24.091469  15.806064  -9.614985  24.091469
866  99  99  12.500000 -12.500000 -17.894817 -13.721749  24.516947 -31.635635   7.163412  24.516947

[867 rows x 10 columns]
Data
- indexpandas.Index
Connection label. Each label refers to a unique connection.
- Pair of fibers:
- Apandas.Series
First fiber label. It must satisfy net.A ≤ net.B.
- Bpandas.Series
Second fiber label. It must satisfy net.A ≤ net.B.
- Curvilinear abscissa:
- sApandas.Series
Curvilinear abscissa of node along the first fiber (mm).
- sBpandas.Series
Curvilinear abscissa of node along the second fiber (mm).
- Relative node positions:
- xApandas.Series
X-coordinate of node along the first fiber (mm).
- yApandas.Series
Y-coordinate of node along the first fiber (mm).
- zApandas.Series
Z-coordinate of node along the first fiber (mm).
- xBpandas.Series
X-coordinate of node along the second fiber (mm).
- yBpandas.Series
Y-coordinate of node along the second fiber (mm).
- zBpandas.Series
Z-coordinate of node along the second fiber (mm).
Attributes
attrs:Global attributes of DataFrame.
Methods
- property attrs
- Global attributes of DataFrame:
- nint
Number of fibers. By default, it is empty (n = 0).
- sizefloat
Box dimensions (mm). By default, the domain is a 50 mm square cube.
- periodicbool
Boundary periodicity. By default, the domain is periodic.
- check()
Check that a
Netobject is defined correctly.This method is called when a
Netobject is initialized.Raises
- KeyError
If any keys are missing from the columns of
Netobject.- AttributeError
If any attributes are missing from the dictionary
attrs.- IndexError
- If row indices are incorrectly defined:
Row indices are not unique in [0, …, m-1] where m is the number of connections.
Connection labels are not sorted.
- TypeError
If labels are not integers.
- ValueError
- If any of the following conditions are not met:
Fiber labels are incorrect.
There are duplicate connections.
Fiber labels are not ordered.
Returns
- bool
Indicates whether the object can be instantiated as
Net.
- static init(mat=None, periodic=True, pairs=None, **kwargs)
Build a fiber network.
Parameters
- matpandas.DataFrame, optional
Set of fibers represented by a
Matobject.
Returns
- netpandas.DataFrame
Initialized
Netobject.
Other Parameters
- periodicbool, optional
If True, fibers are duplicated for periodicity. Default is True.
- pairsnumpy.ndarray, optional
Pairs of fiber indices used to find nearest points. Size: (m x 2).
- kwargs :
Additional keyword arguments ignored by the function.
Example
from fibermat import *

# Generate a set of fibers
mat = Mat(100)
# Build the fiber network
net = Net(mat, periodic=False)

# Check data
Net.check(net)  # or `net.check()`
# -> returns True if correct, otherwise it raises an error.

# Get node data
pairs = net[[*"AB"]].values  # size: (n x 2)
abscissa = net[["sA", "sB"]].values.reshape(-1, 2, 1)  # size: (n x 2 x 1)
points = (net[["xA", "yA", "zA", "xB", "yB", "zB"]]
          .values.reshape(-1, 2, 3))  # size: (n x 2 x 3)

# Figure
fig, ax = plt.subplots(subplot_kw=dict(projection='3d', aspect='equal',
                                       xlabel="X", ylabel="Y", zlabel="Z"))
ax.view_init(azim=45, elev=30, roll=0)
if len(mat):
    # Draw fibers
    for i in tqdm(range(len(mat)), desc="Draw fibers"):
        # Get fiber data
        fiber = mat.iloc[i]
        # Calculate fiber end points
        A = fiber[[*"xyz"]].values - 0.5 * fiber.l * fiber[[*"uvw"]].values
        B = fiber[[*"xyz"]].values + 0.5 * fiber.l * fiber[[*"uvw"]].values
        plt.plot(*np.c_[A, B], c=plt.cm.tab10(i % 10))
if len(points):
    # Draw contacts
    for point in tqdm(points, desc="Draw nodes"):
        plt.plot(*point.T, '--ok', lw=1, mfc='none', ms=3, alpha=0.2)
# Set drawing box dimensions
ax.set_xlim(-0.5 * net.attrs["size"], 0.5 * net.attrs["size"])
ax.set_ylim(-0.5 * net.attrs["size"], 0.5 * net.attrs["size"])
plt.show()
Stack
- class fibermat.net.Stack(*args, **kwargs)
A class inherited from
Netto stack a set of fibers.It solves the linear programming system:
\[\min_{z} (-\mathbf{f} \cdot \mathbf{z}) \quad s.t. \quad \mathbb{C} \, \mathbf{z} \leq \mathbf{H} \quad and \quad \mathbf{z} \geq \mathbf{h} / 2\]\[with \quad \mathbf{f} = -\mathbf{m} \, g \quad and \quad \mathbf{h} > 0\]- where:
𝐳 is the vector of fiber vertical positions (unknowns of the problem).
𝐟 is the vector of fiber weights (with 𝐦 : fiber masses, 𝑔 gravity).
𝐡 is the vector of fiber thicknesses.
ℂ is the matrix of inequality constraints that positions must satisfy to prevent the fibers from crossing each other.
-𝐇 corresponds to the minimum distances between the pairs of fibers.
Non-penetration conditions between two fibers give the expressions of rows of ℂ and 𝐇:
\[z_B - z_A \geq (h_A + h_B) \, / \, 2 \quad \Leftrightarrow \quad z_A - z_B \leq - (h_A + h_B) \, / \, 2\]Parameters
- netpandas.DataFrame, optional
Fiber network represented by a
Netobject.
Other Parameters
- thresholdfloat, optional
Threshold distance value for proximity detection (mm).
- kwargs :
Additional keyword arguments passed to the solver.
Note
The constructor calls
init()method if the object is instantiated with parameters. Otherwise, initialization is performed with the pandas.DataFrame constructor.- Use:
>>> # Generate a set of fibers
>>> mat = Mat(100)
>>> # Build the fiber network
>>> net = Net(mat)
>>> # Stack fibers
>>> stack = Stack(net)
>>> stack
      A   B         sA         sB         xA         yA    zA         xB         yB    zB
0     0   0  12.500000 -12.500000   6.057752  20.856058   0.5  -1.176401  -3.074404   0.5
1     0   2   3.938063  -1.799582   3.580217  12.660413   0.5   3.580217  12.660413   1.5
2     0   3   6.509881   8.253676   4.324414  15.122205   0.5   4.324414  15.122205   2.5
3     0   5   0.269800  -7.165082   2.518746   9.149084   0.5   2.518746   9.149084   1.5
4     0   6 -10.466114   6.264470  -0.587864  -1.127531   0.5  -0.587864  -1.127531   1.5
..   ..  ..        ...        ...        ...        ...   ...        ...        ...   ...
862  95  95  12.500000 -12.500000 -14.234141  11.919304  27.5 -17.446723 -12.873423  27.5
863  96  96  12.500000 -12.500000  15.557356 -19.115497  27.5  -6.906063  -8.143040  27.5
864  97  97  12.500000 -12.500000 -12.739951 -17.721142  27.5 -35.249295  -6.843209  27.5
865  98  98  12.500000 -12.500000  17.087939 -34.582099  27.5  15.806064  -9.614985  27.5
866  99  99  12.500000 -12.500000 -17.894817 -13.721749  26.5 -31.635635   7.163412  26.5

[867 rows x 10 columns]
Data
- indexpandas.Index
Connection label. Each label refers to a unique connection.
- Pair of fibers:
- Apandas.Series
First fiber label. It must satisfy net.A ≤ net.B.
- Bpandas.Series
Second fiber label. It must satisfy net.A ≤ net.B.
- Curvilinear abscissa:
- sApandas.Series
Curvilinear abscissa of node along the first fiber (mm).
- sBpandas.Series
Curvilinear abscissa of node along the second fiber (mm).
- Relative node positions:
- xApandas.Series
X-coordinate of node along the first fiber (mm).
- yApandas.Series
Y-coordinate of node along the first fiber (mm).
- zApandas.Series
Z-coordinate of node along the first fiber (mm).
- xBpandas.Series
X-coordinate of node along the second fiber (mm).
- yBpandas.Series
Y-coordinate of node along the second fiber (mm).
- zBpandas.Series
Z-coordinate of node along the second fiber (mm).
Attributes
attrs:Global attributes of DataFrame.
Methods
init():Stack fibers by gravity.
check():Check that a
Stackobject is defined correctly.solve():Solve the stacking problem.
constraint():Assemble the linear system.
- property attrs
- Global attributes of DataFrame:
- nint
Number of fibers. By default, it is empty (n = 0).
- sizefloat
Box dimensions (mm). By default, the domain is a 50 mm square cube.
- periodicbool
Boundary periodicity. By default, the domain is periodic.
- thresholdfloat
Threshold distance value for proximity detection (mm).
- check()
Check that a
Stackobject is defined correctly.This method is called when a
Stackobject is initialized.Raises
- KeyError
If any keys are missing from the columns of
Stackobject.- AttributeError
If any attributes are missing from the dictionary
attrs.- IndexError
- If row indices are incorrectly defined:
Row indices are not unique in [0, …, m-1] where m is the number of connections.
Connection labels are not sorted.
- TypeError
If labels are not integers.
- ValueError
- If any of the following conditions are not met:
Fiber labels are incorrect.
There are duplicate connections.
Fiber labels are not ordered.
Returns
- bool
Indicates whether the object can be instantiated as
Stack.
- static constraint(net=None, **kwargs)
Assemble the linear system:
\[\min_{z} (-\mathbf{f} \cdot \mathbf{z}) \quad s.t. \quad \mathbb{C} \, \mathbf{z} \leq \mathbf{H} \quad and \quad \mathbf{z} \geq \mathbf{h} / 2\]\[with \quad \mathbf{f} = -\mathbf{m} \, g \quad and \quad \mathbf{h} > 0\]Parameters
- netpd.DataFrame, optional
Fiber network represented by a
Netobject.
Returns
- Csparse matrix
Constraint matrix.
- mgnumpy.ndarray
Force vector.
- Hnumpy.ndarray
Upper-bound vector.
- hnumpy.ndarray
Thickness vector.
Other Parameters
- kwargs :
Additional keyword arguments ignored by the function.
- static init(net=None, threshold=None, **kwargs)
Stack fibers by gravity.
Parameters
- netpandas.DataFrame, optional
Fiber network represented by a
Netobject.
Returns
- stackpandas.DataFrame
Initialized
Stackobject.
Other Parameters
- thresholdfloat, optional
Threshold distance value for proximity detection (mm).
- kwargs :
Additional keyword arguments passed to the solver.
Warning
Matobject is modified during execution.
- static solve(net=None, **kwargs)
Solve the stacking problem.
Parameters
- netpandas.DataFrame, optional
Fiber network represented by a
Netobject.
Returns
- linsolOptimizeResult
Results of linear programming solver.
Other Parameters
- kwargs :
Additional keyword arguments ignored by the function.
See also
The solver is based on scipy.optimize.linprog.
Example
from fibermat import *
# Generate a set of fibers
mat = Mat(100)
# Build the fiber network
net = Net(mat, periodic=False)
# Stack fibers
stack = Stack(net)
# Check data
Stack.check(stack) # or `stack.check()`
# -> returns True if correct, otherwise it raises an error.
# Get the linear system
C, mg, H, h = Stack.constraint(stack)
linsol = Stack.solve(stack)
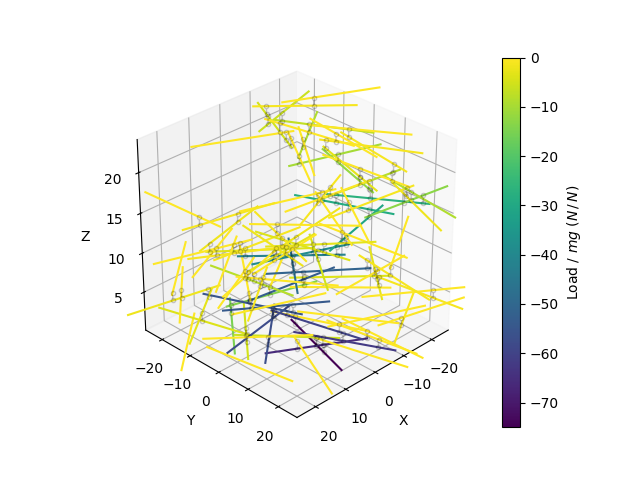
# Contact force
f = linsol.ineqlin.marginals
# Resulting force
load = 0.5 * f @ np.abs(C) + 0.5 * f @ C
# Normalize by fiber weight
load /= np.pi / 4 * mat[[*"lbh"]].prod(axis=1).mean()
# Get loaded nodes
points = (stack[stack.A < stack.B][["xA", "yA", "zA", "xB", "yB", "zB"]]
.values.reshape(-1, 2, 3))
# Prepare color scale
cmap = plt.cm.viridis
color = interp1d([np.min(load), np.max(load)], [0, 1])
# Figure
fig, ax = plt.subplots(subplot_kw=dict(projection='3d', aspect='equal',
xlabel="X", ylabel="Y", zlabel="Z"))
ax.view_init(azim=45, elev=30, roll=0)
if len(mat):
# Draw fibers
for i in tqdm(range(len(mat)), desc="Draw fibers"):
# Get fiber data
fiber = mat.iloc[i]
# Calculate fiber end points
A = fiber[[*"xyz"]].values - 0.5 * fiber.l * fiber[[*"uvw"]].values
B = fiber[[*"xyz"]].values + 0.5 * fiber.l * fiber[[*"uvw"]].values
plt.plot(*np.c_[A, B], c=cmap(color(load[i])))
if len(points):
# Draw contacts
for point in tqdm(points[~np.isclose(f, 0)], desc="Draw nodes"):
plt.plot(*point.T, '--ok', lw=1, mfc='none', ms=3, alpha=0.2)
# Set drawing box dimensions
ax.set_xlim(-0.5 * stack.attrs["size"], 0.5 * stack.attrs["size"])
ax.set_ylim(-0.5 * stack.attrs["size"], 0.5 * stack.attrs["size"])
# Add a color bar
norm = plt.Normalize(vmin=np.min(load), vmax=np.max(load))
smap = plt.cm.ScalarMappable(cmap=cmap, norm=norm)
cbar = plt.colorbar(smap, ax=ax)
cbar.set_label("Load / $mg$ ($N\,/\,N$)")
plt.show()